Annual Farm Summary Data
Latest Updates:
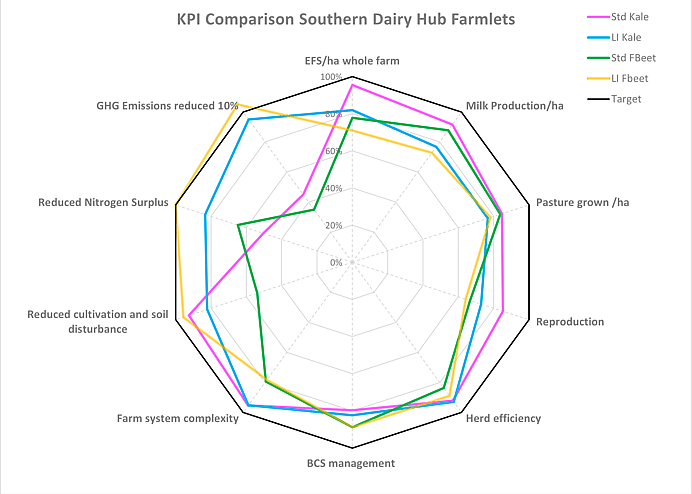
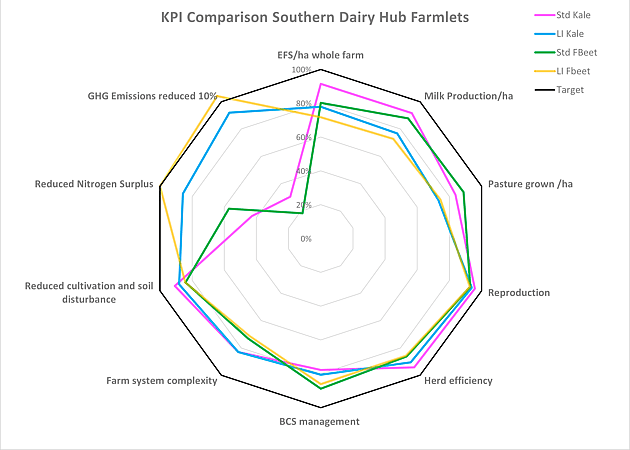
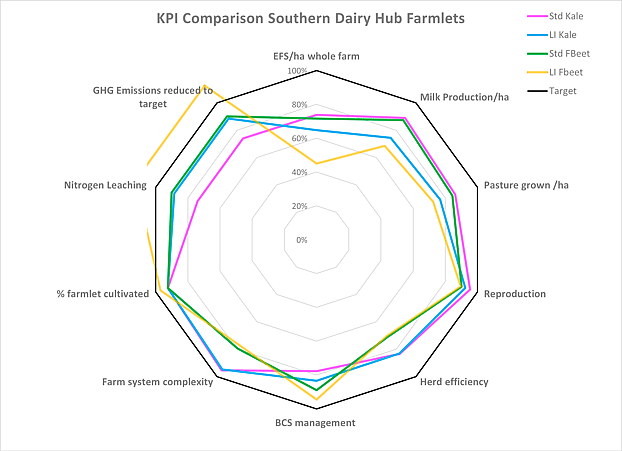
Summary annual farmlet financials are included below, along with what we call our "Wagon Wheel". This is a graph that creates a radar graph assessing farmlet performance in multiple areas at once.
This graphic really highlights the relative strengths and weaknesses of the difference systems - none of them are perfect yet!
2021-2022
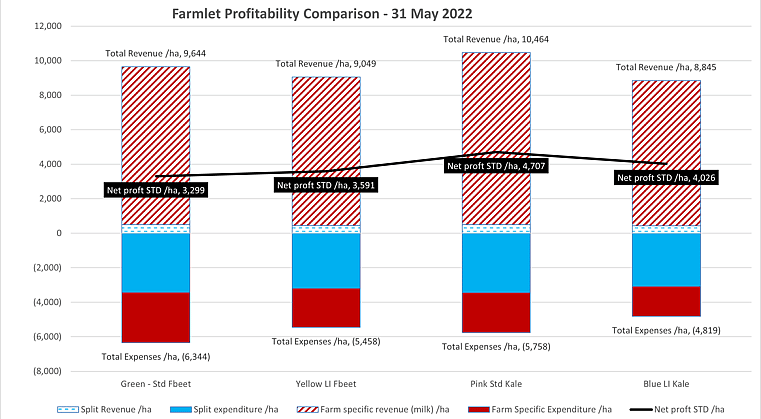
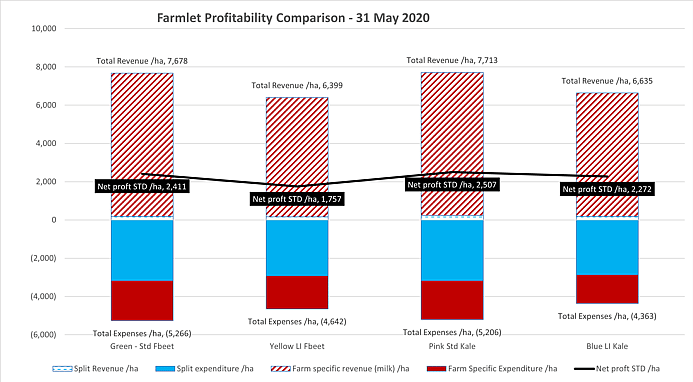
Farmlet financials
Our Season 2021-2022 Farmlet financials are available to download in the link below. We also include a graph comparing per hectare revenue, expenditure and profit
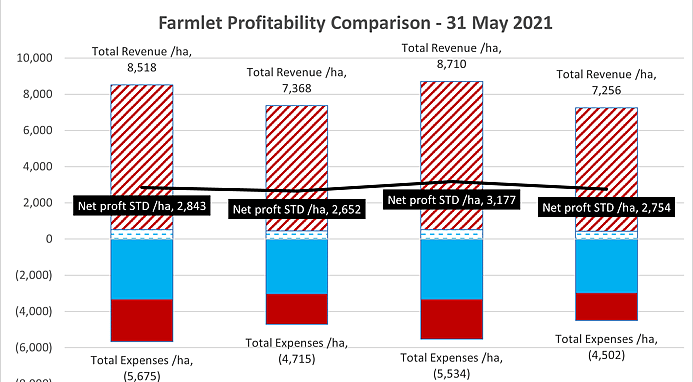
2020-2021 Farmlet financials
Our Season 2020-2021 Farmlet financials are available to download in the link below. We also include a graph comparing per hectare revenue, expenditure and profit
2019-2020 Farmlet financials
Our Season 2019-2020 Farmlet financials are available to download in the link below. We also include a graph comparing per hectare revenue, expenditure and profit
We want to hear from you!
If you have a research idea, want to visit the Hub, or something is missing from our website - let us know!

Stay up to date with our newsletters, weekly HubWatch notes, Field Day notices and other updates.

Farm Data & Research
611 Ryal Bush Wallacetown Road
RD4, Southland 9874
Fonterra Supply Number 31445